Name things once.
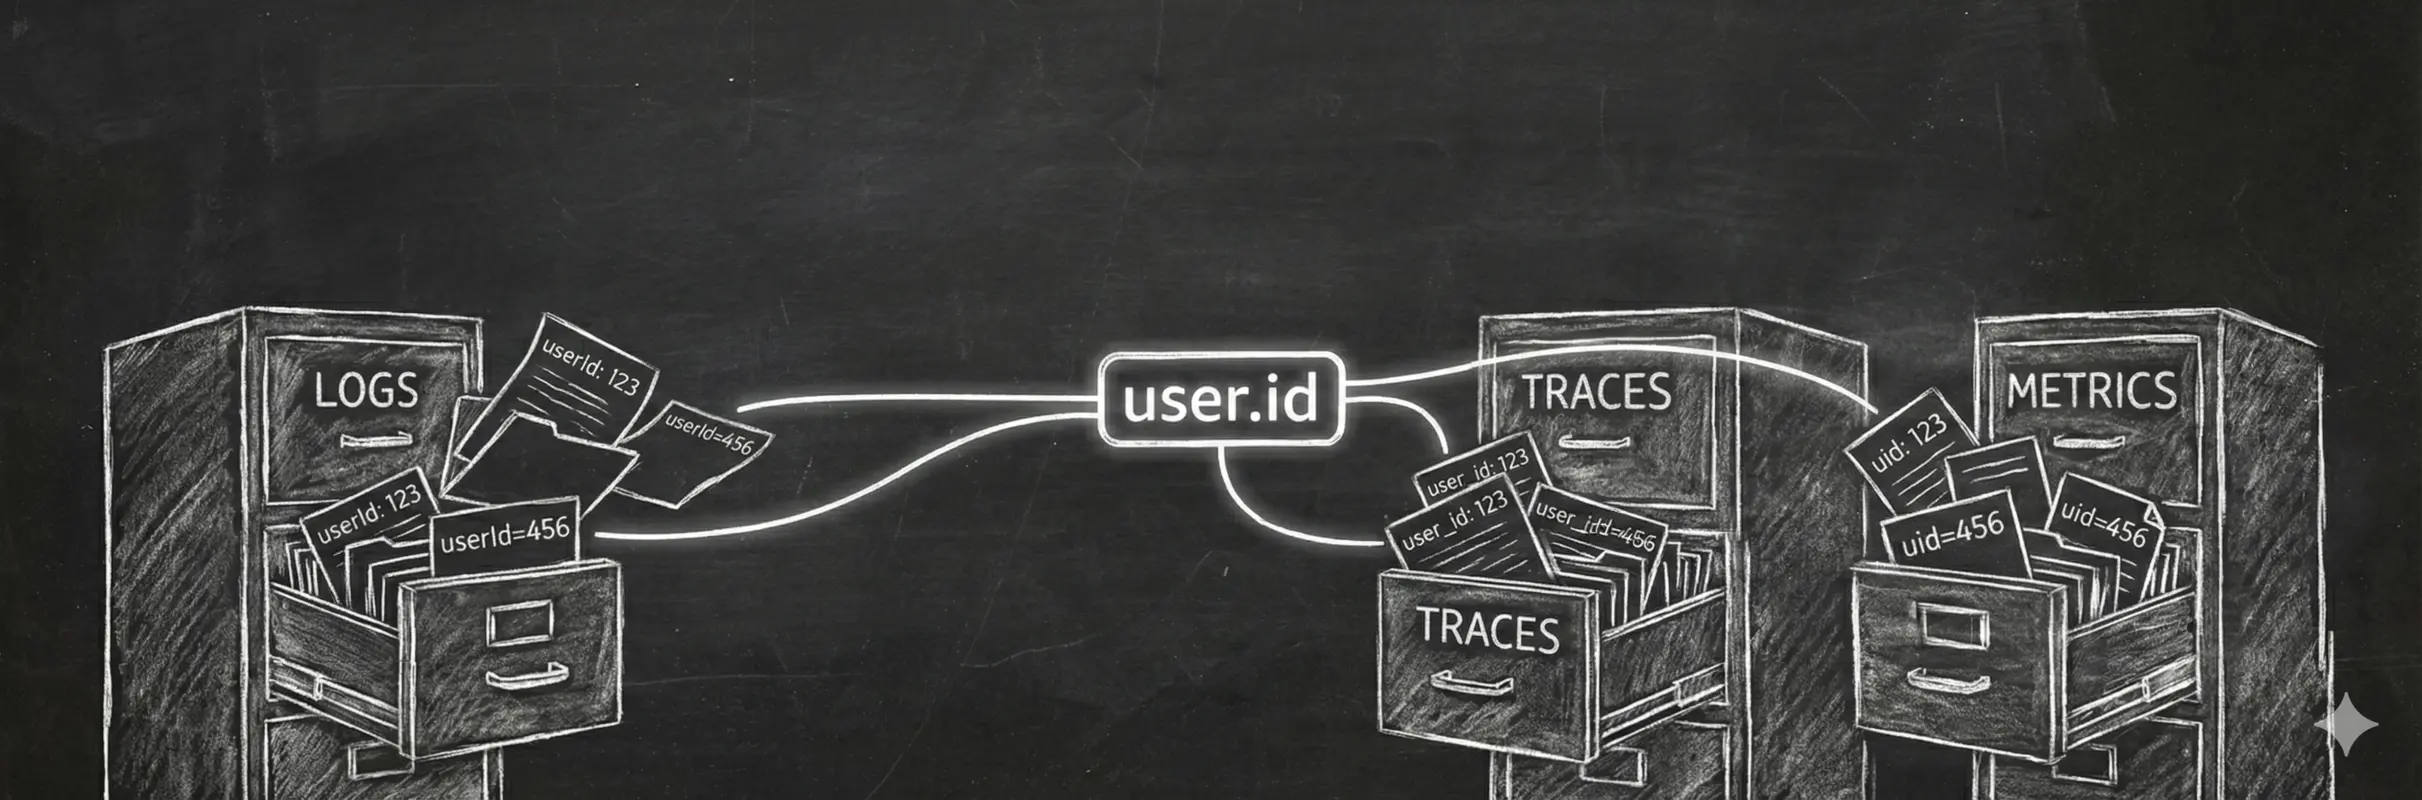
Your logs use userId. Your traces use user_id. Your metrics use uid. Same data, three names, zero cross-signal queries.
Semantic conventions solve this by defining standard names for common concepts. When every signal uses user.id, you can correlate a failed payment in your error tracker with the trace that shows why and the metrics that show how often.
The Standard
OpenTelemetry maintains semantic conventions — a specification of attribute names for common operations. These conventions cover HTTP, databases, messaging, exceptions, and more. Tools that understand these conventions can provide automatic dashboards, correlation, and analysis without custom configuration.
Common Attributes
HTTP spec ↗
// Request attributes
span.setAttribute("http.request.method", "POST");
span.setAttribute("http.route", "/api/orders/{orderId}");
span.setAttribute("url.full", "https://api.example.com/api/orders/123");

// Response attributes
span.setAttribute("http.response.status_code", 201);
Errors and Exceptions spec ↗
// Exception attributes
span.setAttribute("exception.type", "PaymentError");
span.setAttribute("exception.message", "Card declined");
span.setAttribute("exception.stacktrace", error.stack);
Database spec ↗
// Database operation attributes
span.setAttribute("db.system.name", "postgresql");
span.setAttribute("db.namespace", "orders");
span.setAttribute("db.operation.name", "SELECT");
span.setAttribute("db.query.text", "SELECT * FROM orders WHERE id = $1");
GenAI spec ↗
// GenAI request attributes
span.setAttribute("gen_ai.system", "openai");
span.setAttribute("gen_ai.request.model", "gpt-4");
span.setAttribute("gen_ai.operation.name", "chat");

// Response attributes (set after completion)
span.setAttribute("gen_ai.response.model", "gpt-4-0613");
span.setAttribute("gen_ai.usage.input_tokens", 150);
span.setAttribute("gen_ai.usage.output_tokens", 89);
Messaging spec ↗
// Message producer attributes
span.setAttribute("messaging.system", "kafka");
span.setAttribute("messaging.destination.name", "order-events");
span.setAttribute("messaging.operation.type", "publish");
span.setAttribute("messaging.message.id", messageId);
Service Identity spec ↗
// Resource attributes (set once at startup)
resource.setAttribute("service.name", "checkout-api");
resource.setAttribute("service.version", "1.4.2");
resource.setAttribute("deployment.environment.name", "production");
Domain-Specific Attributes
Semantic conventions cover infrastructure. For your domain, define your own attributes using a consistent namespace.
// Domain attributes for an e-commerce app
span.setAttribute("order.id", orderId);
span.setAttribute("order.total", 149.99);
span.setAttribute("order.item_count", 3);
span.setAttribute("user.tier", "premium");
span.setAttribute("payment.provider", "stripe");
span.setAttribute("payment.method", "card");user.id as a metric attribute creates millions of time series. Use bounded values like user.tier for metrics. Traces and logs handle high cardinality fine.Consistency Rules
Pick one name and use it everywhere. If it's order.id in traces, it's order.id in logs, metrics labels, and error context. Document your conventions somewhere your team will actually read.
Use dots for namespacing. http.request.method is clearer than httpRequestMethod or http_request_method. OTel uses dots, so you should too.
Be specific. duration_ms is better than duration. error.count is better than errors. Units and types in the name prevent misinterpretation.
Cross-Signal Correlation
The real payoff comes when you query across signals. Same order.id in your error, trace, and logs means you can start from a Slack alert about a payment failure and trace it back to the exact request, see every log line, and check whether this order ID shows up in your "failed orders" metric spike.
import { trace } from "@opentelemetry/api";
import { getLogger } from "@logtape/logtape";
import { logError } from "./errors";
import { incrementCounter } from "./metrics";

const logger = getLogger(["app", "orders"]);

export async function processOrder(orderId: string, userId: string) {
  const span = trace.getActiveSpan();

  // Same attributes everywhere
  const context = { "order.id": orderId, "user.id": userId };

  span?.setAttributes(context);
  logger.info("Processing order", context);

  try {
    await chargePayment(orderId);
    incrementCounter("orders.completed", { "user.tier": getUserTier(userId) });
  } catch (error) {
    logError(error, context);
    incrementCounter("orders.failed", { "user.tier": getUserTier(userId) });
    throw error;
  }
}
When that order fails at 3am, you search for order.id = "abc123" and get the error with stack trace, the trace showing where it failed, and every log line from that request. No grepping, no guessing which service to check first.